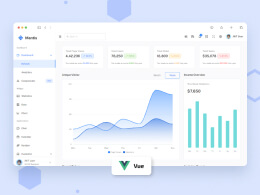
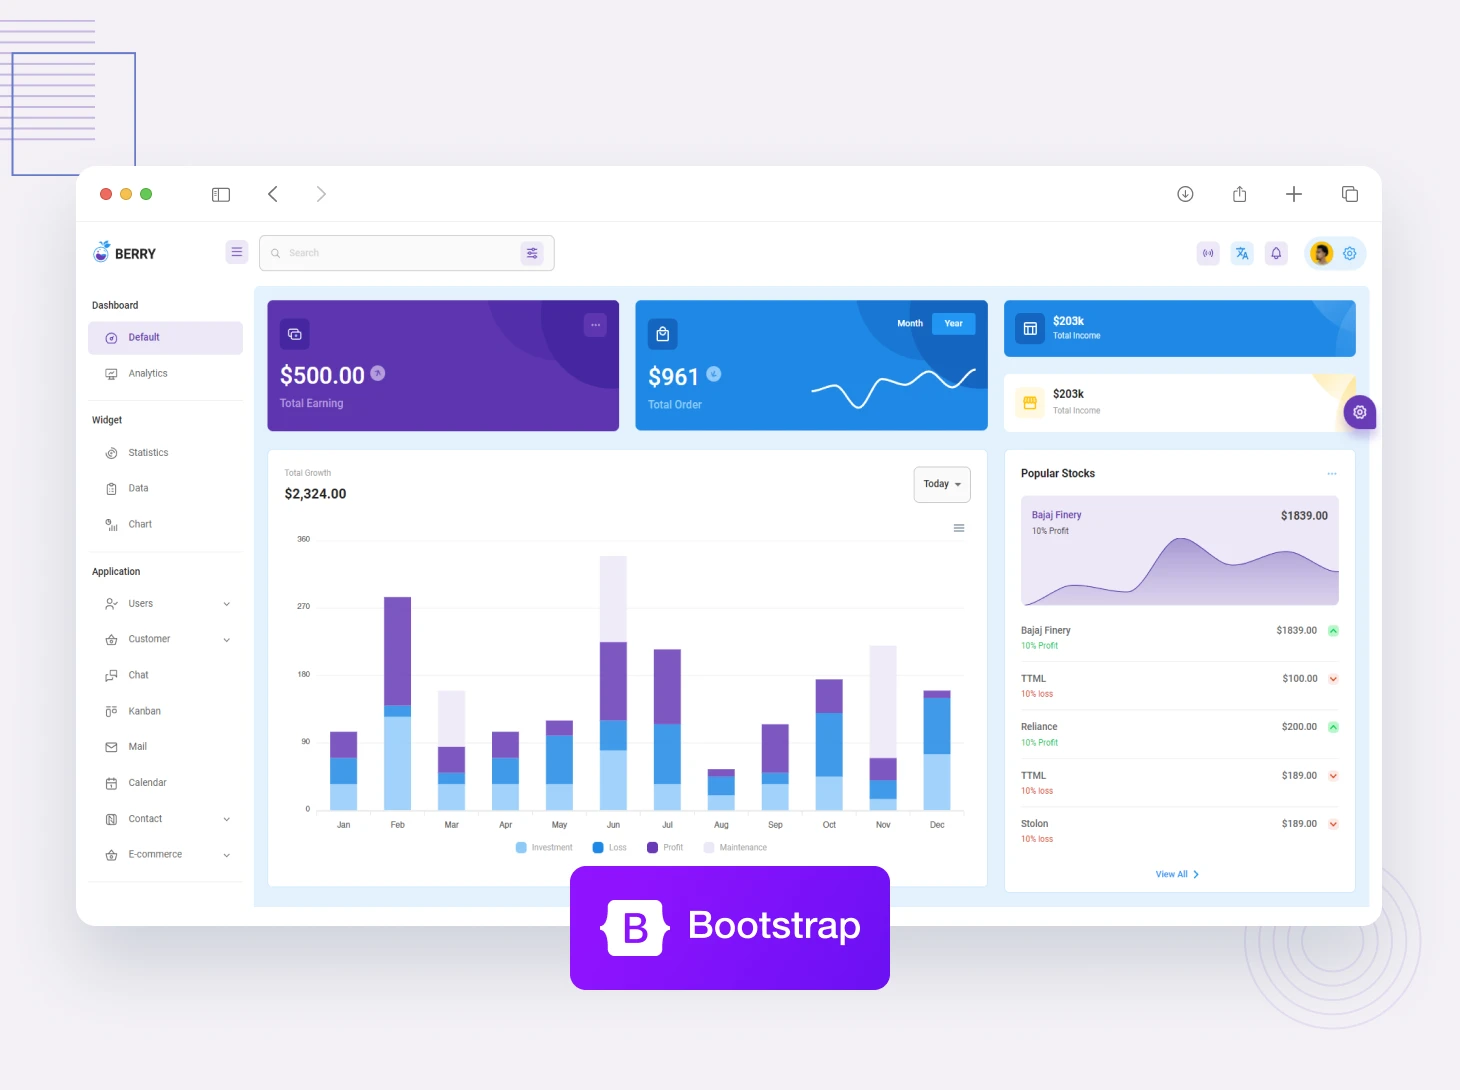
Instead of digging through spreadsheets or reports, using charts or graphs to represent complicated data sets is far more accessible. Data visualization is one approach to understanding massive datasets. It allows you to visually portray various scenarios and makes it easy to see trends and business insights in real-time.


